|
Section 4: Evaluating Risk and Reward over the next five years
Choosing a Future High Price
- Now, you will calculate the High Price that the stock is forecasted to reach in the next five years. The price is calculated by multiplying the Average High Price/Earnings Ratio (from Section 3, Row 7, Column D) by the Estimated High Earnings Per Share.

A common question from beginners is, "Where do I get the "Estimated High Earnings Per Share" for this calculation?" The answer is from the trend line you drew on Page 1 of the SSG form. Find the point where the EPS trend line you drew intersected with the last year on the graph -- that's your projection of the stock's high EPS over the next five years.
However, before you calculate the High Price, you should apply some judgement to the selection of a future Average High Price/Earnings Ratio, rather than blithely filling in the blank from the default value.
A stock's P/E Ratio reflects the market's expectations of that stock's future growth, so a company that is growing very rapidly will have a Price/Earnings Ratio that is also very high. Over time, it is very rare for a company to maintain annual earnings growth more than 30%, and as that growth inevitably slows, the P/E Ratio will decline as well. In addition, companies with high P/E Ratios are susceptible to severe "corrections" if the company's earnings miss analysts' expectations for a single quarter. If you accept a High P/E Ratio that is very high, you will set a Future High Price target that the stock will unlikely reach.
Well, how high is too high? Ralph Seger, the Repair Shop columnist from Better Investing magazine, often says that, as high P/E Ratios discount the future, very high P/E Ratios discount the hereafter as well! He advises investors never to project a future High Price/Earnings Ratio that is greater than 20.
While this may be a conservative approach, in any case, a High P/E Ratio that's higher than 25 should give a prudent investor cause to re-evaluate the choice. By cautiously selecting a High P/E Ratio that best reflect's the company's future growth, you can avoid a nasty surprise later on.
Choosing a Low Price
- The SSG form gives you four options for a Future Low Price. You can choose one of the four choices, or select an altogether different low price.
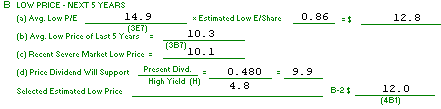
This choice is derived from the Average Low P/E Ratio (from the Section 3 chart, Row 7, Column E) and the Estimated Low Earnings Per Share.
Again, you should always apply judgement to the choice of a Low P/E Ratio, just as you did in the choice of a High P/E Ratio. If the stock's Average Low P/E Ratio is more than 15 or 20, that might signal a downward revision.
The Estimated Low Earnings Per Share also generates confusion because this figure appears nowhere on the SSG form. The "by-the-book" method of analysis suggest using the most recent year's EPS, on the assumption that a growth company's most recent year's EPS will always be the lowest of the coming five years, as the company continues to increase its earnings.
For fast-growing companies, you may wish to use the EPS from the most recent four quarters, in lieu of the most recent year's. This takes the assumption of growth one step further, and will give you a Low Price choice that is, in most cases, very reasonable.
The "Average Low Price of the Last Five Years" is found in Row 7, Column B, of the chart in Section 3.
The "Recent Severe Market Low Price" requires you to select a Low Price from the Section 3 chart, depending on what you consider "recent." Some investors consider the last five years to be recent, some only look at the last three years. You must use your own judgement in selecting a low price here.
The "Price Dividend Will Support" is calculated by dividing the Present Dividend (for the entire year, often referred to as the "indicated dividend") by your choice of a High Yield from Column H in Section 3. Usually, you will use the most recent year's High Yield, but you must apply your own judgement.
This choice is relevant when a stock is being purchased because of its dividend income potential, and is not very helpful in choosing a low price for a growth stock.
After making these calculations, you must select the stock's Future Low Price. Remember, to paraphrase Peter Lynch, "a stock's price can always go down until it hits zero." While you don't have to worry about this possibility with most growth stocks, you should always carefully consider your choice of a Low Price. Some investors always choose a Low Price that is at least 10% to 25% below the current price, to give a buffer in case of a general market correction. Other investors find that the Low Price calculated by multiplying the Average Low P/E Ratio by the Low EPS is the most realistic. Whatever your choice, your Low Price should never be higher than the stock's current price.
Zoning
-
The next step in the SSG is to calculate three price zones between the Forecast Low and High Prices: BUY, MAYBE and SELL. This entails substracting the Forecast Low Price from the Forecast High Price, then dividing the result by 3.
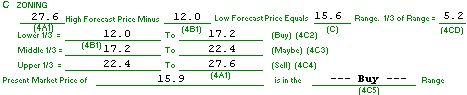
Now, fill in your Future Low Price in the first blank in the Lower 1/3 line. Add "1/3 of Range" to the Low Price to discover the top of the BUY zone, and fill it in the appropriate blank, as well as on the next line as the bottom of the middle, MAYBE zone.
Next, add 1/3 of Range to the top of the BUY zone to reach the top of the MAYBE zone. Fill in this figure, and as the bottom of the SELL zone.
Finally, fill in your Forecast High Price as the top of the SELL zone.
Note: Some experienced investors divide the Zones into four parts, with the bottom 25% as the BUY zone, the middle 50% is the MAYBE zone and the top 25% is the SELL zone. This makes the price at top of the BUY zone equal to a 3:1 Upside/Downside Ratio. This advanced technique applies a more stringent criteria to the stock.
Upside/Downside Ratio
- The Upside/Downside Ratio compares the potential gain if the stock reaches your Forecast High Price from the Current Price (the "Upside"), to the potential loss if the stock drops to your Forecast Low Price (the "Downside").
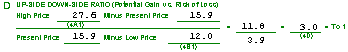
A $10 stock with a Low Price of $5 and a High Price of $15 has an equal chance of gaining $5 or losing $5 -- a 1:1 Upside/Downside Ratio. A $10 stock with a high price of $20 and a low price of $5 has a 2:1 Upside/Downside Ratio, or twice the potential on the Upside as on the Downside.
The NAIC recommends that you only purchase stocks with a 3:1 Upside/Downside Ratio.
Many investors will reject an Upside/Downside that is greater than 12 or 15 to 1, reconsidering their choices of High and Low Prices.
For the calculation, subtract the Present Price from the High Price, and subtract the Low Price from the Present Price. Divide these two figures, and the result is the Upside/Downside Ratio.
Interpreting the Results
- Zoning often confuses beginning investors because a stock in the BUY zone may not always be a stock to BUY. Some other criteria to look for:
- Upside/Downside Ratio greater than 3:1.
- Relative Value less than 100%. (In other words, the stock's current P/E Ratio is less than the Average P/E Ratio.)
- Price in BUY zone. (Some investors require the stock's price to be in the lower half of the BUY zone, or use the 25%-50%-25% zoning method described above.)
- Price is forecast to double in the next five years. (This roughly represents a 15% annual return on your initial investment, before dividends are calculated.)
If the stock you are studying does not pay dividends, you can stop here! Otherwise, continue to Section 5: 5-Year Potential.
Next
|
|