|
Section 5: Five-Year Potential
The final step in completing the Stock Selection Guide is Section 5, "5-Year Potential," determining the stock's current and future dividend yield. The calculations are fairly simple; if the stock doesn't pay dividends, you can skip this section altogether.
Calculating Present Yield
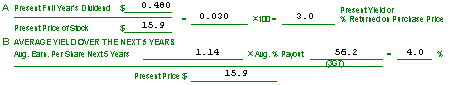
- To calculate the present yield, the percentage of the stock's price that is paid back in dividends each year, first figure out the total dividends that will be paid in the current year. You can multiply the most recent quarterly dividend by four to find the current dividend. Next divide the dividend by the current price of the stock, and multiply by 100 to determine the "Present Yield or % Returned on Purchase Price".
Calculating Average Yield
- Now, you need to calculate the the Average Earnings Per Share over the next five years. Go back to the Section 1 graph and look at your trend line. Find where it intersects each of the next five years, and determine the actual amount of Earnings Per Share you expect the stock to earn in each year. In this stock's case, you might figure that the next five year's E/S are the following:
$0.92
$1.04
$1.12
$1.24
$1.38
Adding these together, you get $5.70. Now divide by 5 to get the Average E/S, or $1.14.
A shortcut to determine the Average Earnings Per Share over the next five years is to simply use the projected earnings per share figure from the third (middle) year of the next five year period. Assuming that future earnings have been determined by using a straight trend line, this figure will be the Average EPS. As you can see in the example above, the calculated figure is $1.14 and the middle-year figure is $1.12, just a slight variance due to the imprecision of the graph.
Now, multiply $1.14 times the Average % Payout from Section 3, Column G, Row 7 (in this case case, 56.2%, or .562), which gives you $0.64 (the Average Dividend). Divide by the stock's Current Price, $15 7/8, to get the Average Yield, which equals 0.040, or 4.0%. Based on your initial investment, this stock will pay an average annual dividend over the next five years that is 4.0% of the purchase price.
As with many other parts of the Stock Selection Guide, you should use your judgement in considering the stock's average yield and payout. If the company's Average Yield and/or Average % Payout have been rising in recent years, you may wish to use higher figures for these calculations than the calculated averages. Likewise, if a downward trend is indicated, you might use a lower figure.
Interpreting the Results
- This section is not as critical because the SSG is best suited in analyzing growth stocks which may not pay a high dividend or any dividend at all. But often the dividend yield can provide the extra "kicker" to help boost the Total Return of a medium-growing stock above the 15.0% goal.
In cases where you are looking at income-producing investments, you can use the Present and Average Yield as benchmarks to compare the stock's return to other yielding investments such as bonds, savings accounts or money market funds, for instance.
You can also use the stock's yield when comparing stocks for potential purchase: if you expect two stocks to each return 15% annually, the stock with the higher dividend yield may often provide the "safer" investment, one that is less dependent on the uncertainties of the general market.
Next
|
|